Webgl Traffic Analyzer
Last weekend I created a WebGL Traffic Globe Analyzer thing for our operations centre video wall.
Here it is.
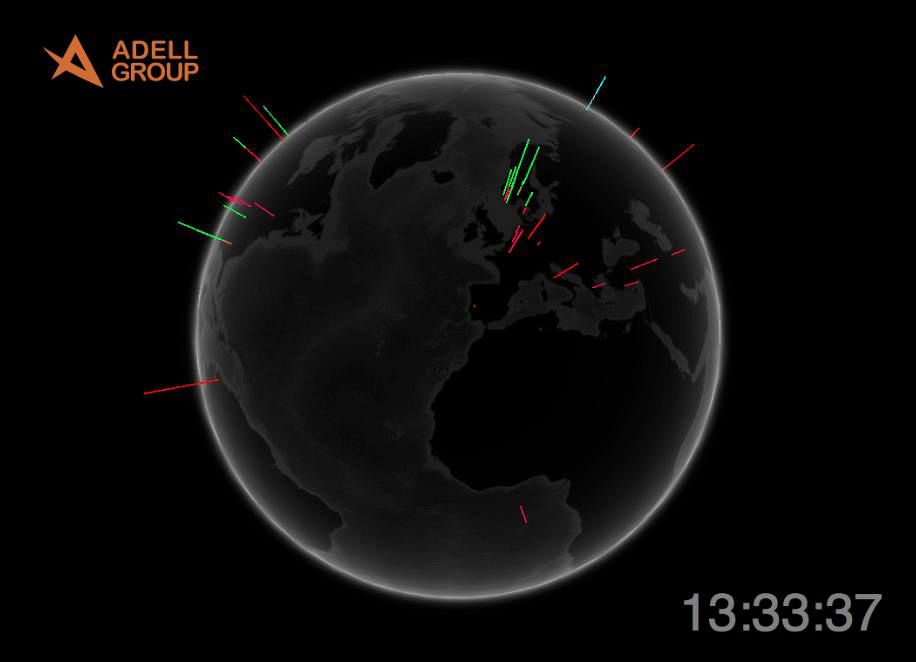
Project is deeply inspired by a similar globe I once saw in a lobby somewhere in Silicon Valley, but that one was “just” displaying aggregate search traffic. I’ve tried to mix in some sensor data from our IDS system and firewalls to make it a bit more interesting to look at with our comparatively humble dataset.
It’s really more eye candy than useful, especially since only I know what the different colors represent (..but maybe you can guess some of them?).
You know what they say, there are only two kinds of people in this world — those who can extrapolate from incomplete data sets…